The state of the market for olive products is an important element in ensuring viability for our industry, highlighting opportunities for future production direction. AOA OliveCare® Code of Best Practice Administrator Peter McFarlane prepared this overview of the recent International Olive Council (IOC) March newsletter, which provided some interesting insight into current trends with its focus on Australia.
Olive oil
Imports of olive oil and olive pomace oil into Australia increased by 13.1% in the last crop year. The olive oil market in Australia maintained continuous growth during the period from 2015/16 to 2019/20. In 2019/20, imports reached 36 558T, which is 36.2% more than in the 2015/16 crop year.
Table I shows changes in imports over the last five crop years. Spain, with an increase of 31.1% compared to the previous crop year, is Australia’s main supplier.
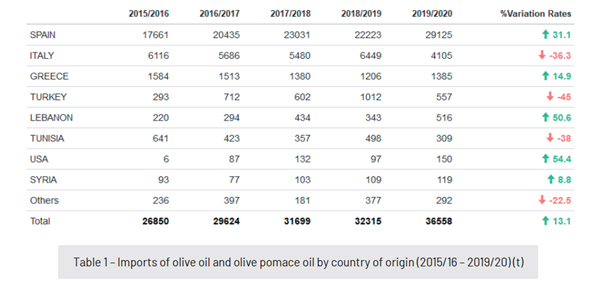
In the 2019/20 crop year, just over 94% of all olive oil and olive pomace oil imports into Australia came from EU countries. Spain led the way with 79.7%, followed by Italy with 11.2%. The remaining countries are below 4%.
In terms of volumes by product category, 61.2% of imports were under code 15.09.10 (virgin olive oils), 37.8% were under code 15.09.90 (olive oils) and the remaining 1% under code 15.10.00 (olive pomace oils).
Imports of virgin olive oils and olive oils have shown a change in trend since the 2014/2015 crop year. The volume of virgin olive oil imported has increased by 75.5% if we compare the 2019/2020 crop year with the 2007/2008 crop year, when they represented 46% of imports.
PMcF note: This indicates the Australian market is moving away from refined olive oils to virgin olive oils.
Table Olives
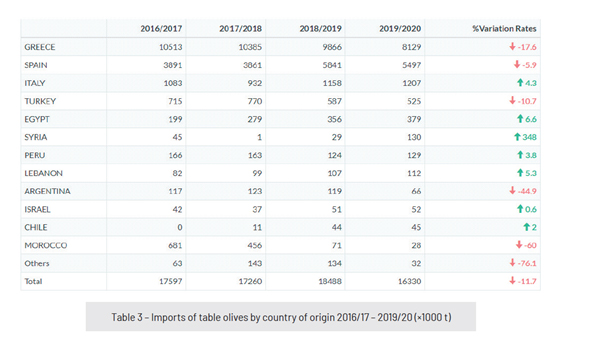
The Australian table olive market stood at around 17,000T for the last 12 crop years, reaching 16,330T in 2019/20 (September 2019 – August 2020), around 2.5% of world imports.
Table II shows imports in the last crop year by country of origin. Greece is the main supplier, with 49.8% of the imported volume (8,129T), followed by Spain with 33.7% (5,497T); Italy 7.4% (1,207T) and Turkey with 3.2% (525T). The remaining countries are below 3%.
You can read the full March IOC newsletter here.
Further information is also available in updated overviews for Australian olive oil and table olives produced by the AOA. View the Olive Oil Overview 2020 here and the Table Olive Overview 2020 here.